Life Grid: your journey in weeks and months
An 80-year life fits in a little over 4,000 weeks. Laid side by side, those weeks form a grid that fits on one screen — and it changes how you look at the time already lived. VitaeMap's Life Grid fills those cells with your real events.
Free, no credit card required.
What is the Life Grid?
The Life Grid is a VitaeMap display mode inspired by the classic "life in weeks" chart. Time is cut into cells: one row per year, one cell per week (52 per row) or per month (12 per row). A grey cell is a period with no recorded event; a coloured cell contains at least one. A click opens the event, and a dot marks clickable cells when colouring uses a gradient.
How to read the grid
One row = one year
Years stack from top to bottom. The height of the grid is the time span covered by your VitaeMap.
One cell = one week or one month
You choose the granularity. Weeks give the fine grain and the "4,000 weeks" effect; months give a calmer read, better for long journeys.
Colour by category, tag or indicator
Categorical colouring with a colour-blind friendly palette, or a continuous indicator gradient for premium accounts (impact, satisfaction, emotional intensity, level).
Every cell is clickable
Hover for a preview, click for the detail. When several events fall in the same cell, a picker lets you choose.
Setting it up
The Life Grid is enabled from your VitaeMap editor, in the Display modes tab.
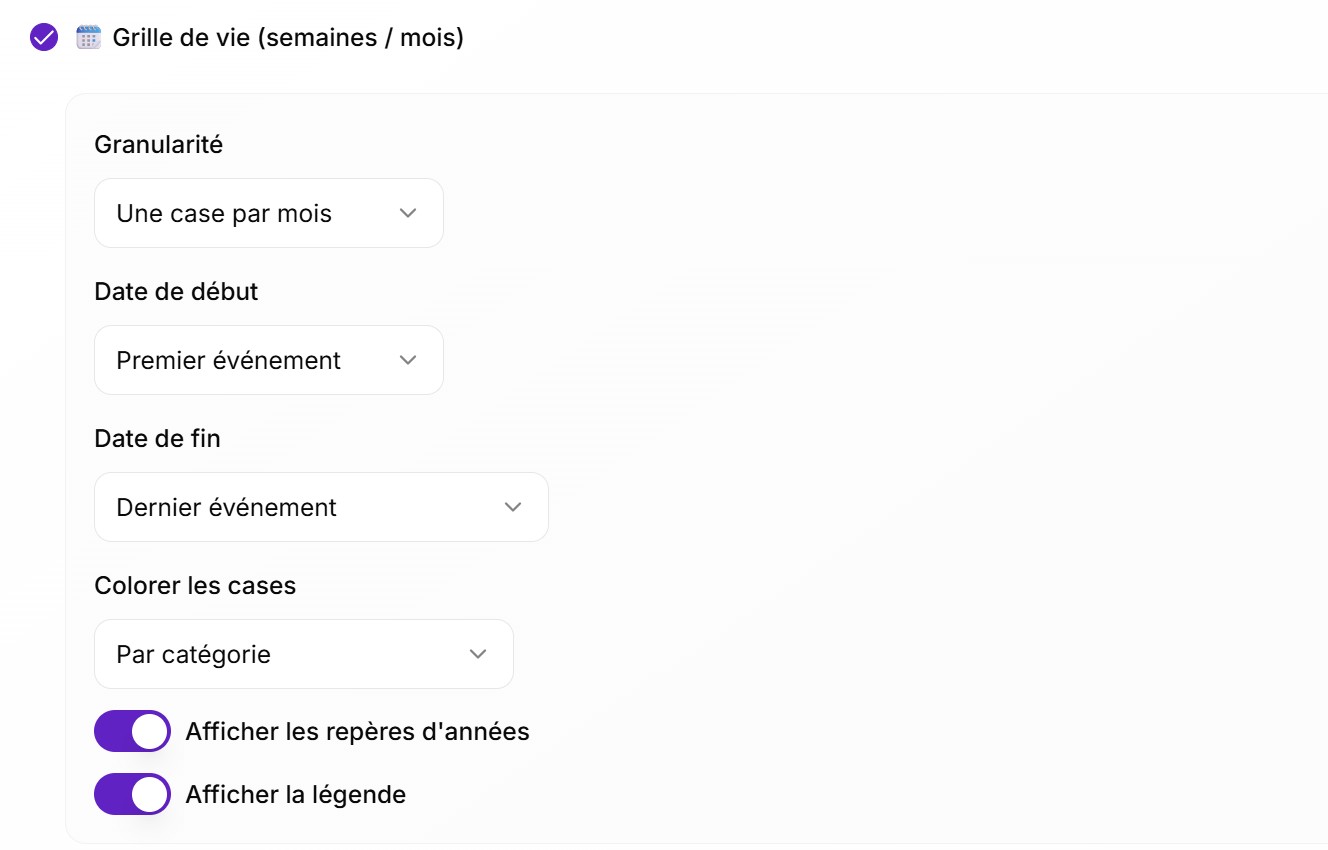
Weeks or months
Pick the granularity and the time span: your events, your birth date, or any custom date.
Create a VitaeMap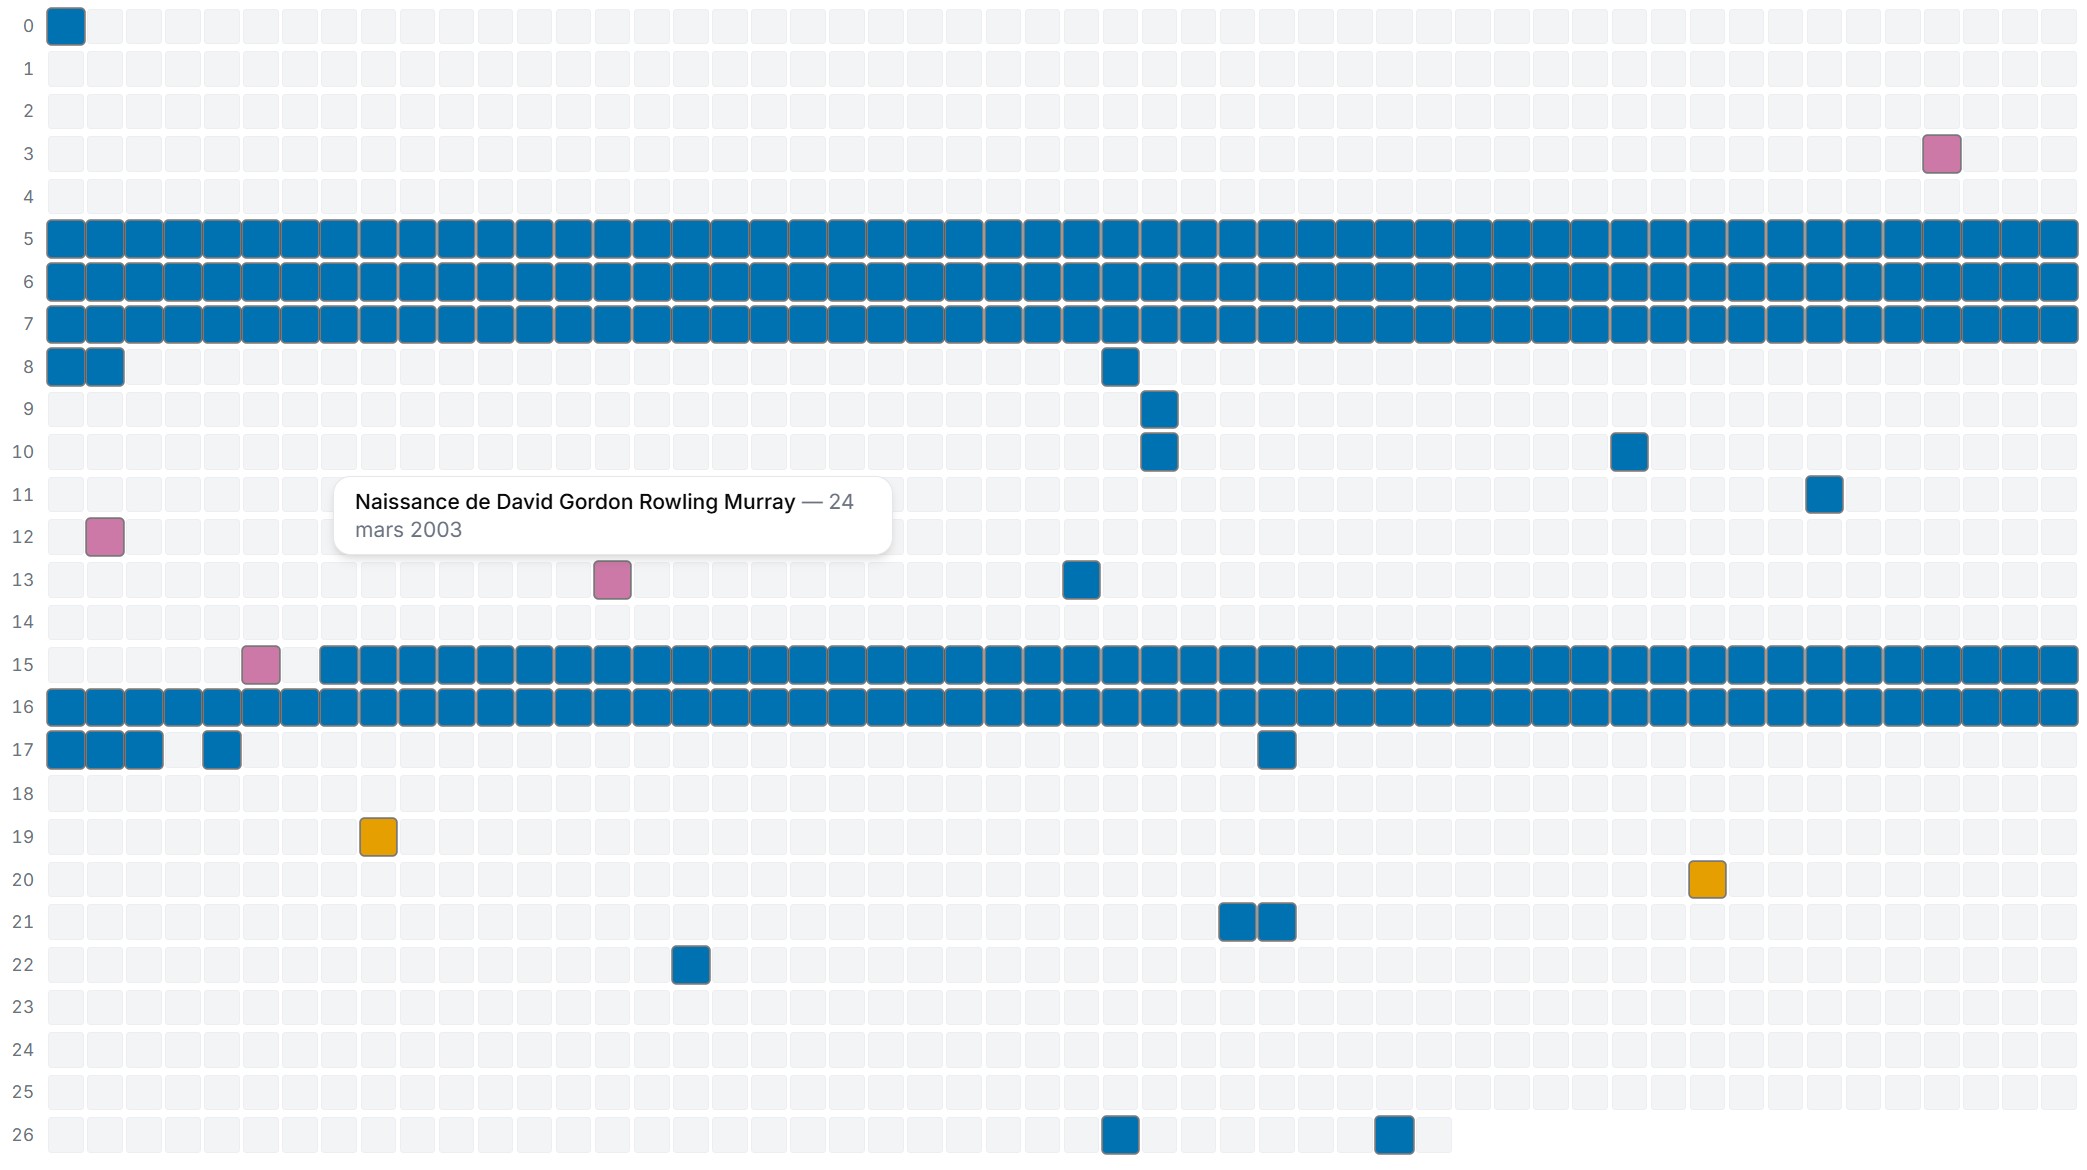
Colours and gradients
Category, tag, or indicator gradient with optional interpolation of event-free periods (premium).
What the grid reveals
Time becomes tangible
Seeing the weeks already gone, in one block, does something no list can do: time stops being abstract. It is the best nudge to start documenting your life again.
Gaps say as much as cells
Empty periods are not empty lives: they are undocumented zones. The grid makes them visible, and makes you want to fill them.
Chapters emerge
Coloured by category, the grid surfaces the big phases: studies, first job, moving abroad, career change. Blocks of colour draw chapters.
Readable on mobile
On small screens each year automatically splits into two half-year rows: no more horizontal scrolling.
Frequently asked questions
Is the Life Grid free?
Yes. The mode is available on every account. Only indicator gradient colouring and interpolation of event-free periods require premium.
How are short events handled?
An event shorter than 24 hours occupies a single cell, even when it crosses midnight. A long event colours every cell it spans.
Can the grid start at my birth?
Yes: the start date can follow your first event, your birth date, or any date you choose.
How is it different from Vitae Rings?
The Life Grid is rectangular and sequential: best for measuring and counting time. Vitae Rings is circular: best for comparing the same months across years and spotting cycles.
Read next
Fill in your cells
Add your events, switch on the Life Grid and watch your journey appear week after week.