Creating Your First Interactive Life Map on VitaeMap: The Complete Tutorial
There are different ways to create a vitaemap using easy wizards. Though this article will help you follow the more complete way. By doing so, you will understand the philosophy of VitaeMap.
On VitaeMap, the event is the raw material — not the map. A trip, a job, a milestone: each one exists for itself first, before it even knows which map it will end up on. And the same event can feed several maps at once — that business trip can easily sit on both a travel map and a career map, depending on which angle you want to tell that day from.
That's why you don't start by structuring a map. You start with what you've lived, or what you're living, without trying to organize it right away. You let yourself follow the thread — one memory calling up another — and you assemble only afterward, once several events already exist and a direction starts to show.
Step 1: create your events, not your map directly
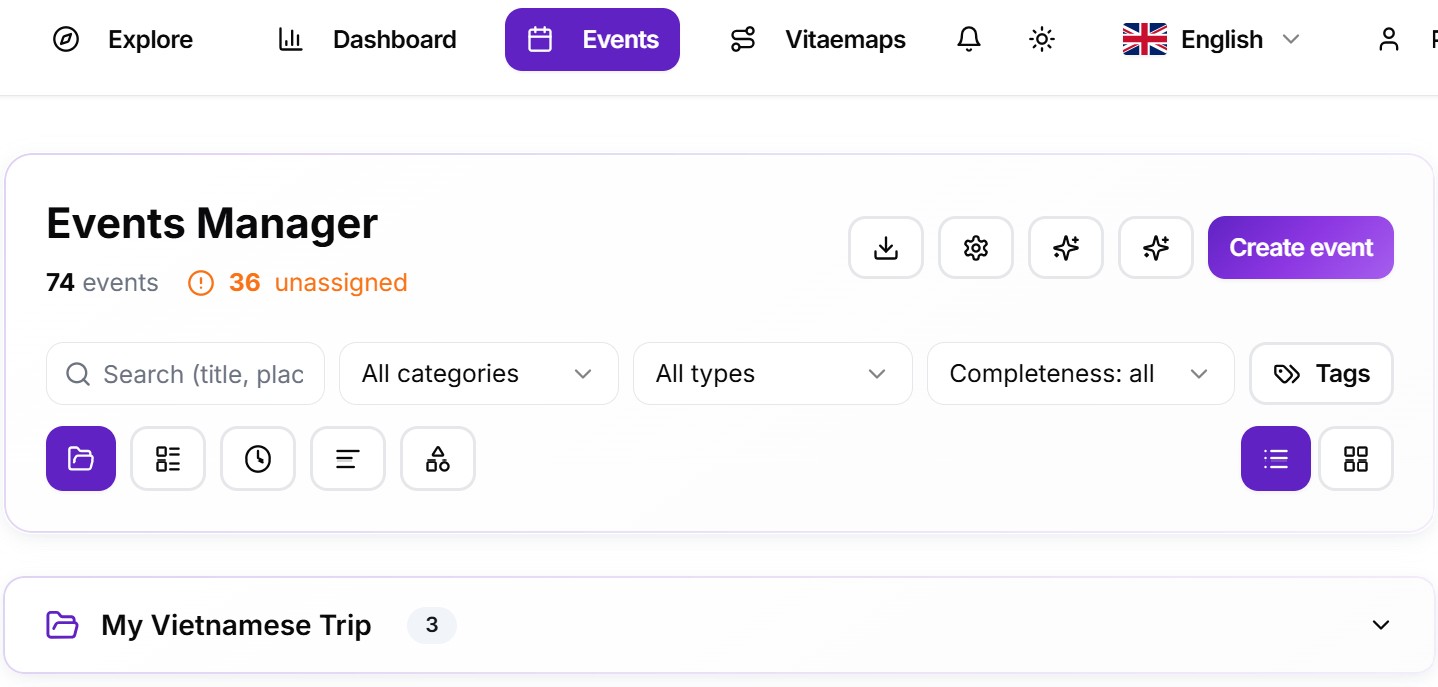
Once your account is created, the dashboard shows the Events tab.
Click "Create an event."
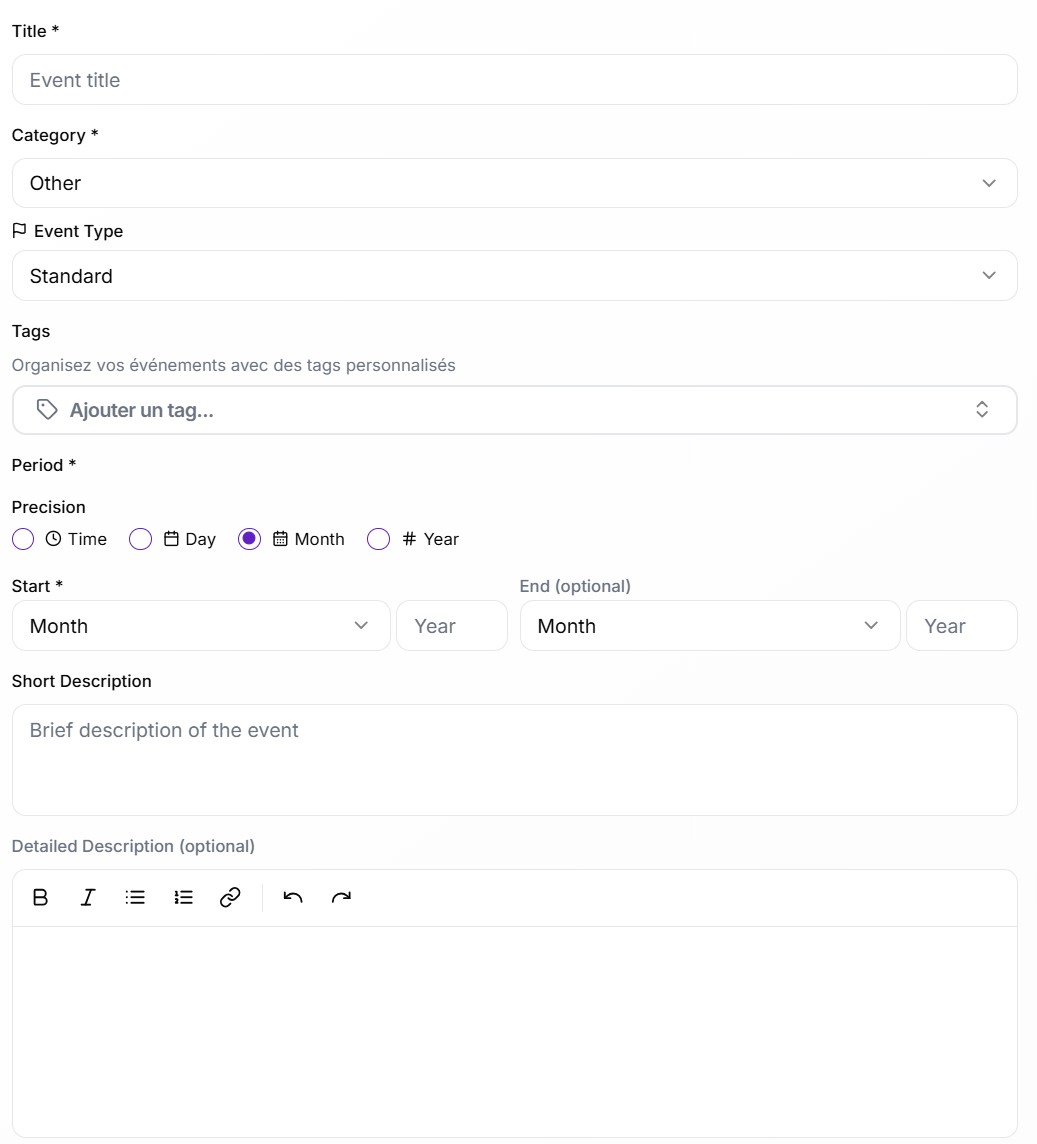
In the Information tab, fill in the title (required), the category (required) help distinguishes if the event if it is a work, a familiy, a personal, a hobby ones. Afterwards you can use the event type to point out if this event is an achievement, a turning point or a recognition for example (there are 12 different event types. You can also choose to add some tags on your event, while it is not mandatory it helps to organize them and are used in some representations. Afterwards, you have to precise the period by choosing the right precision between time, day, month, or year and then a required start date and an optional end date. To finish, you should write a short description, and a detailed description. In the detailed description, you can use some styling.
if needed.If this event should appear on the geographic map representation, go to the Location tab. Three ways to set the place, your choice: type an address into the search field (with autocomplete — "Paris, France" is enough to be recognized), click directly on a map, or manually enter a latitude and longitude. A "My position" shortcut offers your current location. This is optional, but without it the event only exists in time, not in space.
Optional: add an image in the Images tab (one on the free plan, up to three on premium).
Also optional, the Indicators tab lets you rate the event on several axes at once: Satisfaction (a star rating), Impact (a slider), Emotional intensity (a slider running from negative to positive, with a face that changes expression), and Level. Up to five custom indicators can be added on top. These are the indicators that show up on the free plan and that unlock representations like the Emotional Trek on premium.
Save.
Step 2: repeat for a few events
There's no official minimum. With a single event, the representations don't really kick in: it just displays up close. For a map to start telling something readable, a handful of events is already enough — three to five for a first map. Some denser representations, like Vitae Rings or the Life Grid (Week in Life), make more sense from around ten events onward, but that's not necessary to get a feel for the tool.
Step 3: choose the story these events are going to tell
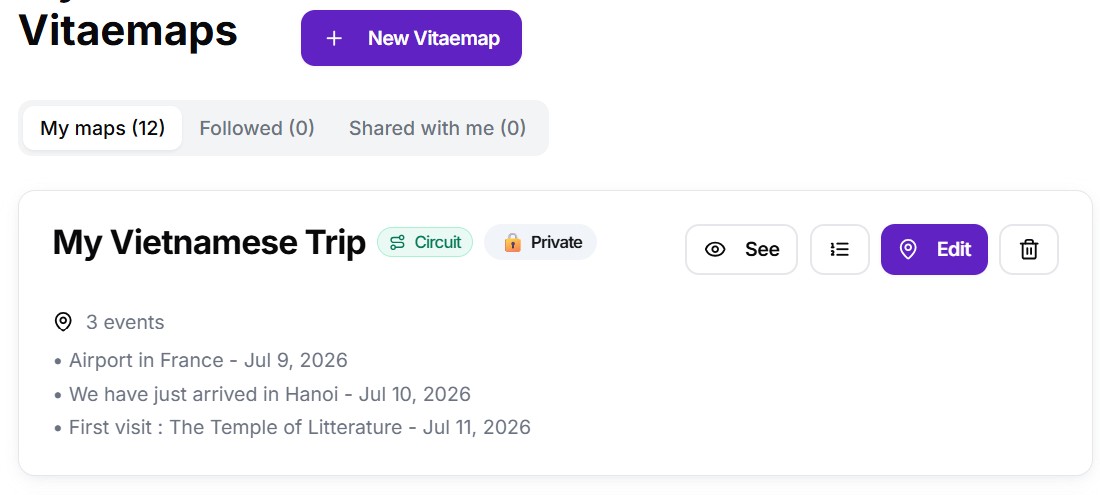
The events now exist for themselves, independent of any map — it's now up to you to choose the story you want to tell with them. The same business trip can join a travel map today and a career map tomorrow: nothing is fixed, an event can belong to several VitaeMaps at the same time. Assembling a map isn't about filing events away — it's about choosing which ones tell the story you have in mind right now.
In the VitaeMaps tab, click "New VitaeMap."
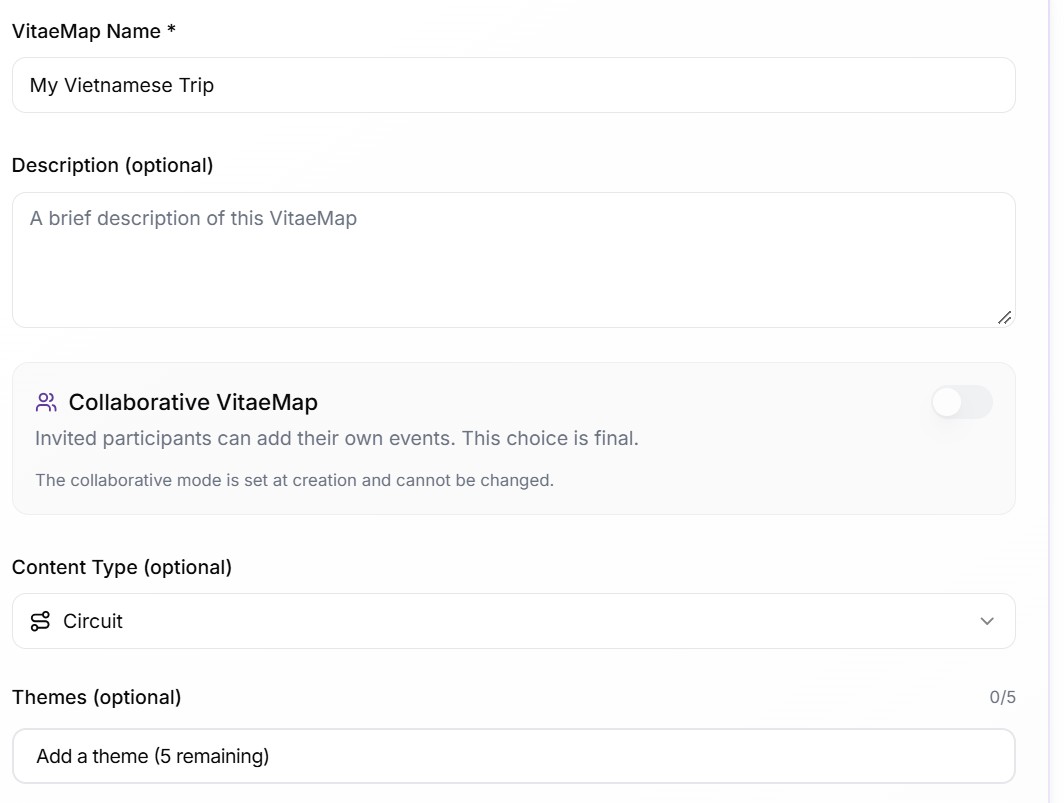
In the Info tab, give the map a name (required) and, if you want, a description. For a first map, the more advanced options (collaborative VitaeMap, content type, themes, custom cover) can wait.
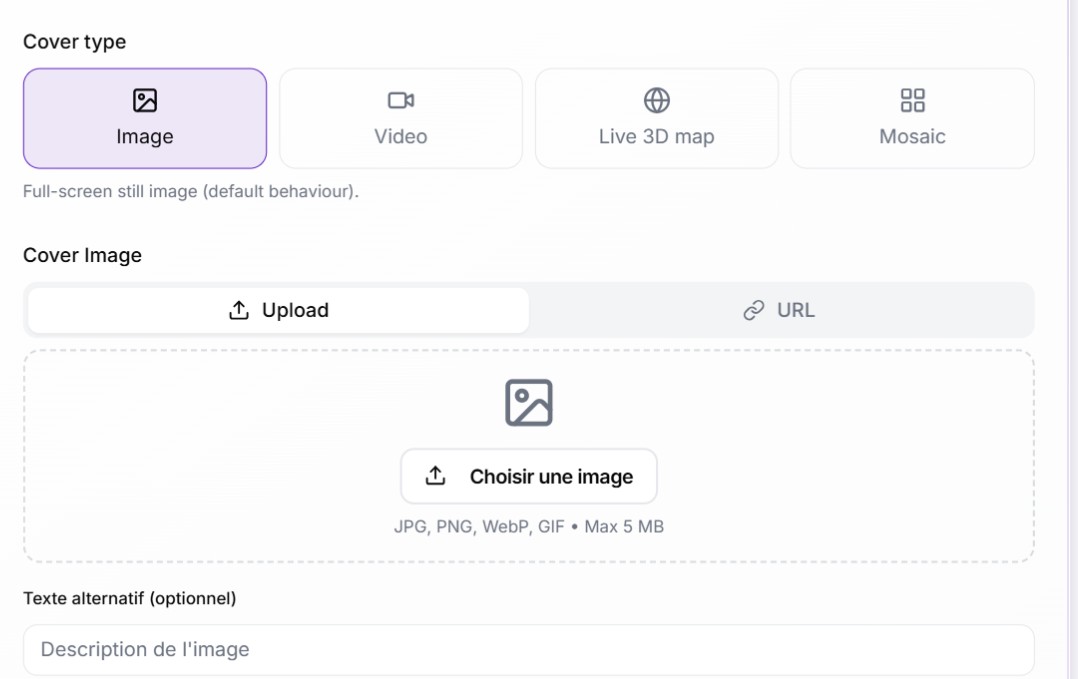
You should test the various option of the Cover. The basic one is to add an image but you can also add a small video, or a live 3D map of your events or a Mosaic of all the pictures of your vitaemap.
In the Events tab, the list of every event you've already created shows up: check the ones that belong to this particular story. Nothing simpler — and nothing final, an event you leave unchecked here stays available for another map, and can be removed at any time via the trash icon.
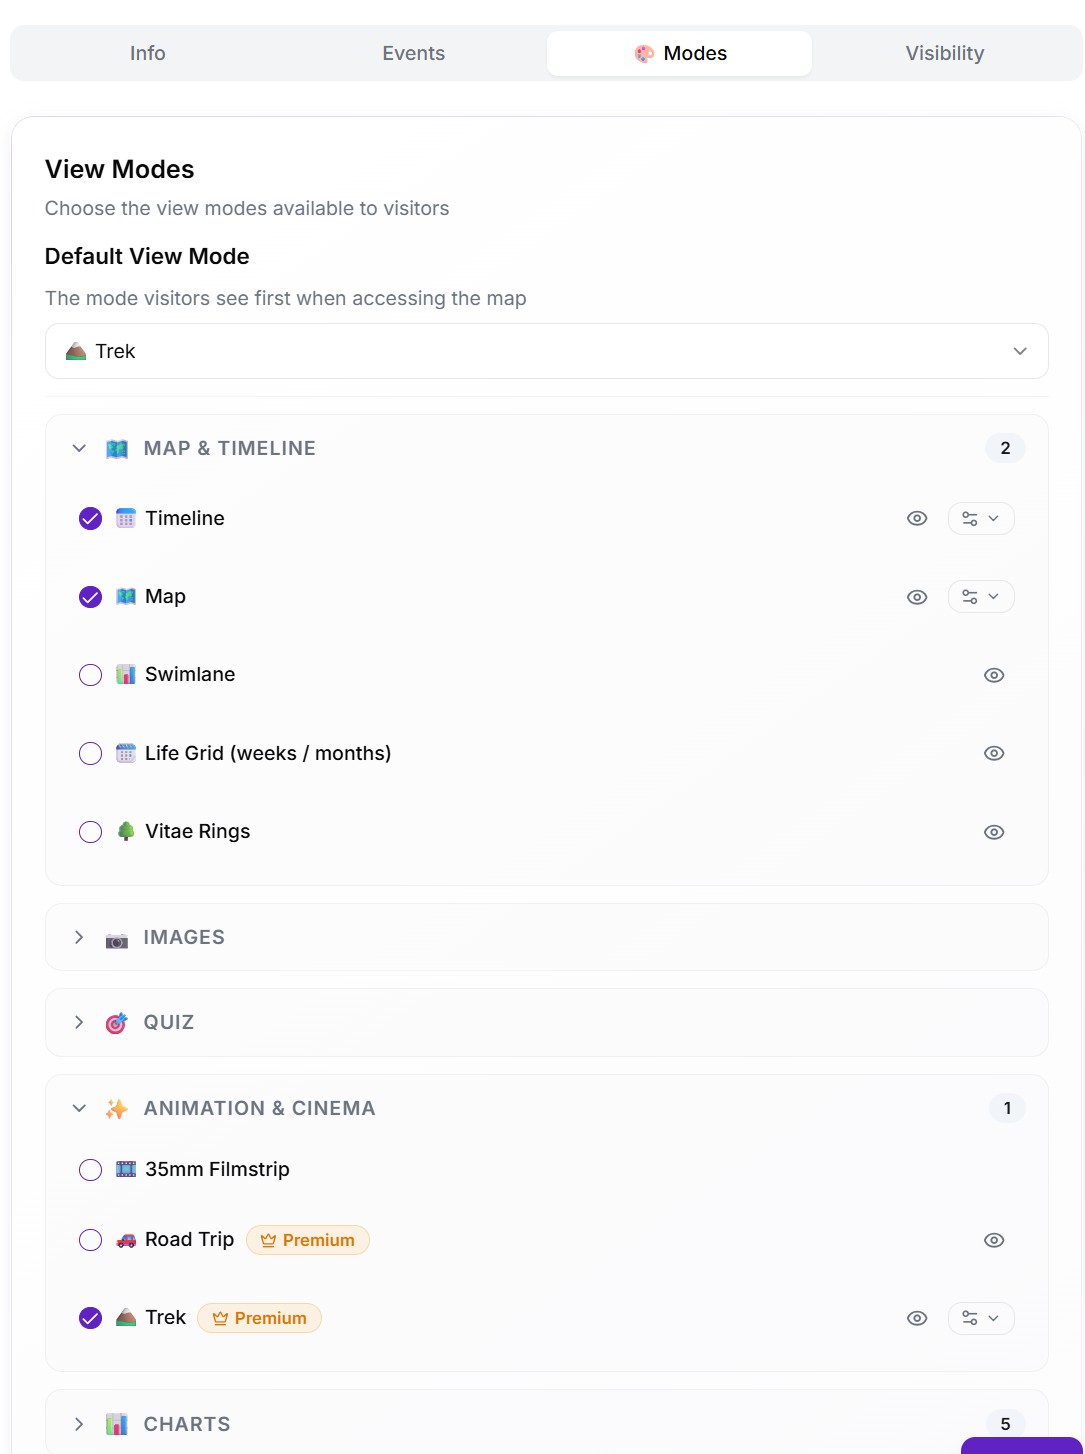
In the Modes tab, two things to set: the "Default View Mode" — the representation you land on first when opening the map, Timeline for instance — and the list of enabled representations, grouped by category. If choosing the events in the previous step defined the substance of the story, the modes define its form: Map & Timeline structures the narrative in space and time (Timeline, Map, Swimlane, Life Grid, Vitae Rings); Images tells the story through pictures rather than text (carousel, gallery, Polaroids, Patchwork); Quiz doesn't tell a story but asks one — you get guessed on a placement on a map, a timeline, or an indicator (the last one reserved for premium); Animation & Cinema brings the story to life (Reel on the free plan, Trek and Road Trip on premium); Charts offers a more analytical read, like the Tier List. For a first map, the five Map & Timeline modes are more than enough to explore what changing representations actually changes — the other categories are worth discovering once you've understood that switching modes changes the form, not the substance.
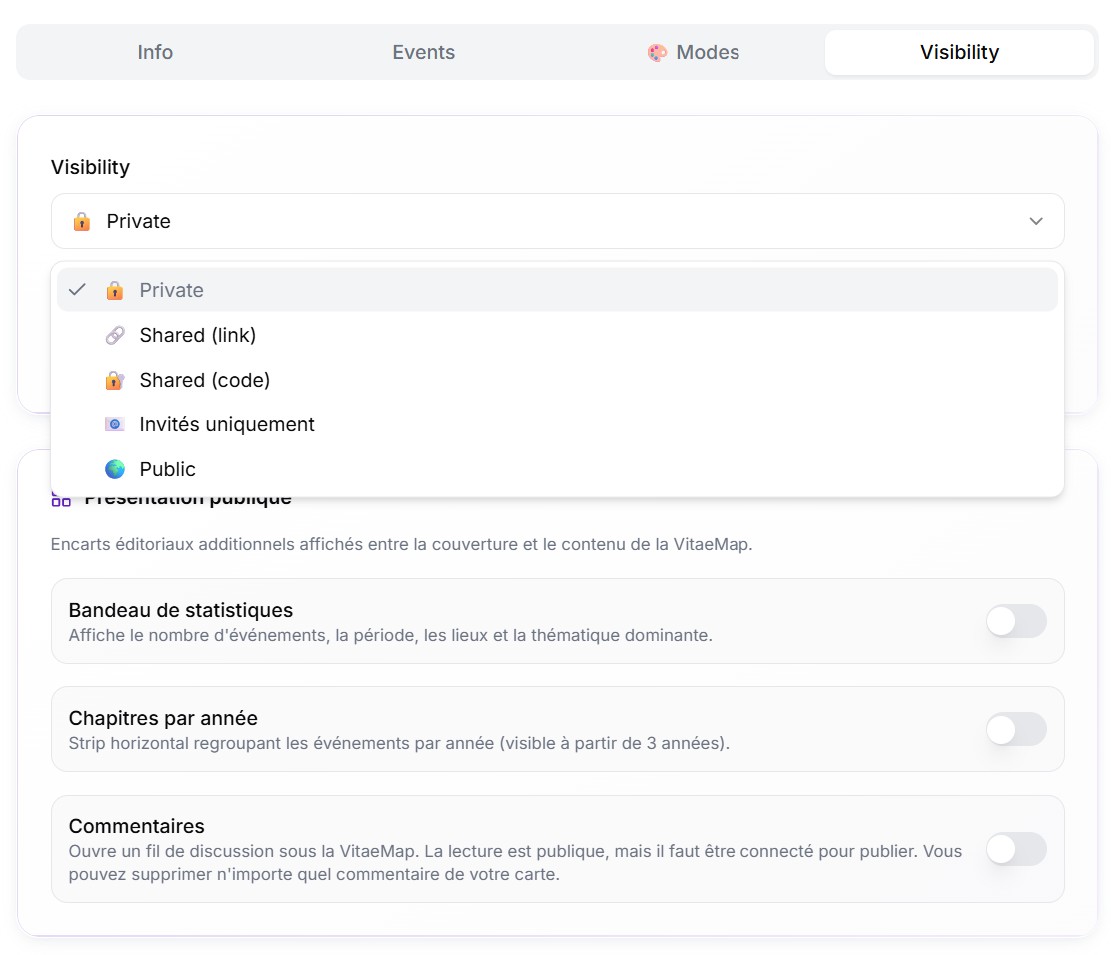
In the Visibility tab, a first setting chooses who can see the map — private, link, or public — with a separate option to make it accessible to everyone who visits the link, not just the people you send it to directly. A "Public presentation" section lets you turn on, as you choose, a stats banner (number of events, time span, places, dominant theme), chapters grouped by year, and a comment thread under the map. For a first map, no need to turn everything on at once — these settings can be changed at any time, even after publishing.
Click "Create VitaeMap."
What to explore next
Once your first map is assembled, the simplest thing is to look it over and play with the settings yourself: try the different display modes on a photo (a sepia effect gives a memory a different tone), switch from one representation to another to see how the same journey reads differently, add one more event to watch the map evolve. It's by testing that you understand what each representation tells better than another. Once you're happy with the result, all that's left is to share it.